ROCE (Return on Capital Employed): Full Form, Formula, Ratio & Calculation Explained
Every rupee a company uses — whether borrowed or owned — should earn its keep. That's exactly what ROCE (Return on Capital Employed) measures. It tells you how efficiently a business converts its total capital into operating profit. Miss this ratio, and you might be investing in a company that looks profitable on the surface but quietly destroys value underneath.
Key Takeaways
-
A higher ROCE signals better capital efficiency
-
15%–20% or above is generally considered a healthy benchmark
-
Always compare ROCE within the same industry — cross-sector comparisons mislead
-
A steadily rising ROCE over several years is a strong positive sign
What Is ROCE — Return on Capital Employed?
ROCE shows how much operating profit a company earns for every rupee of capital it has put to work. Capital here means everything — equity and debt combined. So unlike ROE, which only looks at shareholders' money, ROCE gives you the full picture.
A higher ROCE means the business is doing more with what it has. Simple as that.
ROCE Formula and How to Calculate It
Investors rely on ROCE to judge whether a company genuinely deserves more capital — or whether it's already struggling to justify what it has.
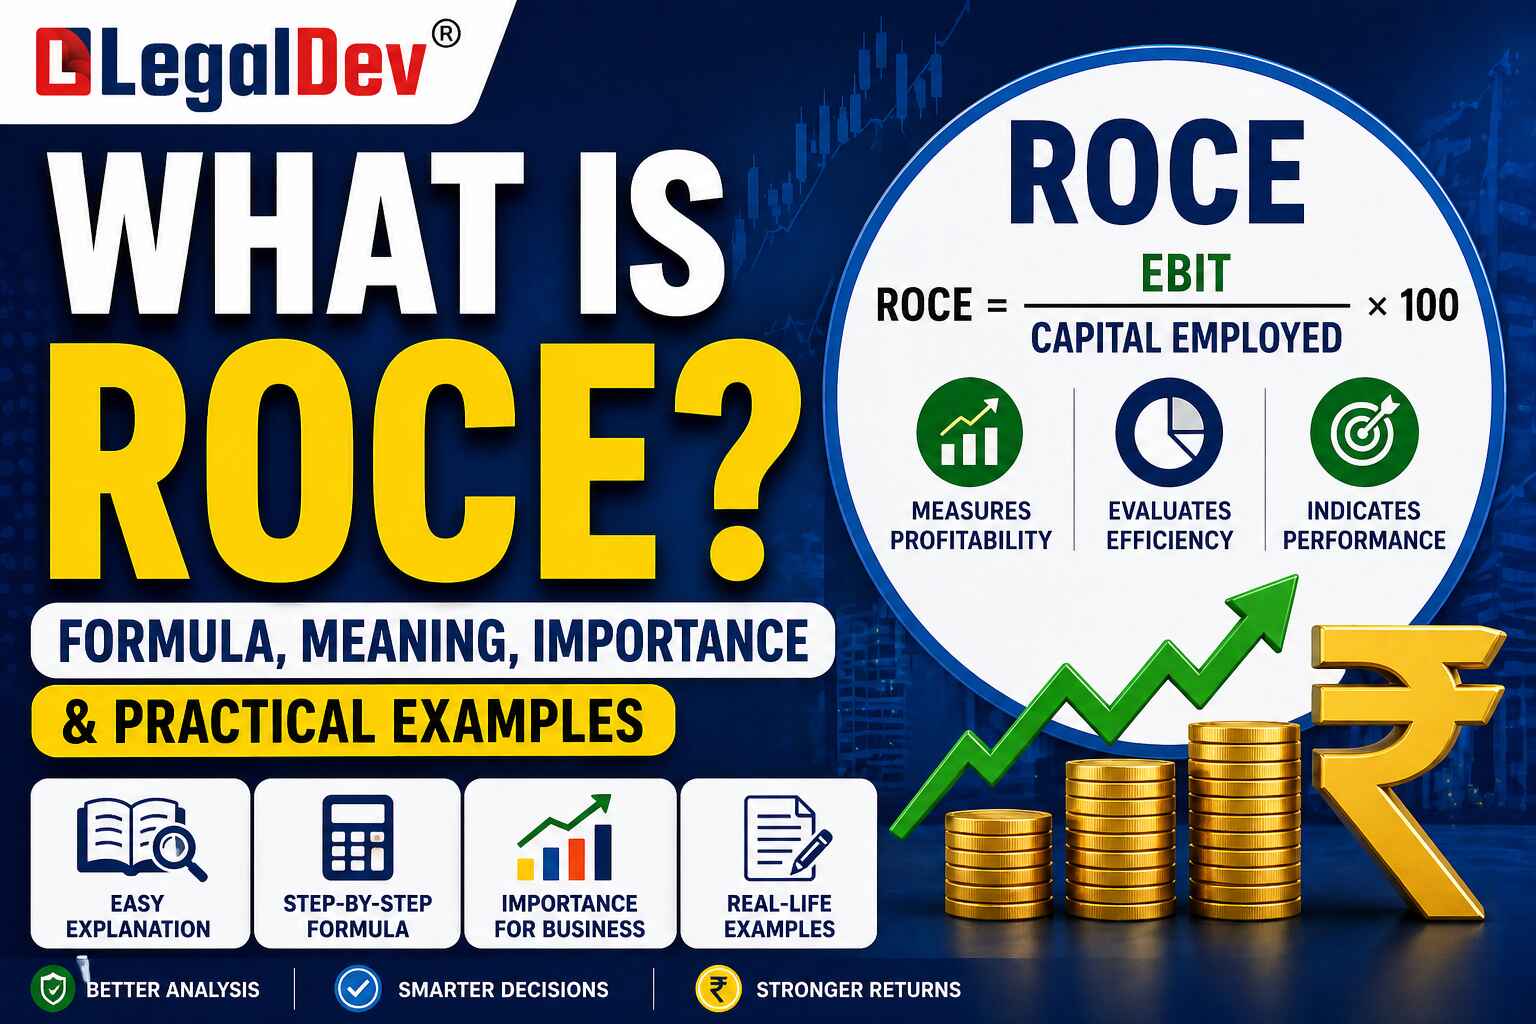
ROCE Formula:
ROCE = (EBIT ÷ Capital Employed) × 100
Where:
-
EBIT = Earnings Before Interest and Taxes
-
Capital Employed = Total Assets − Current Liabilities
ROCE Calculation Example: Company A vs Company B
Let's work through a real comparison. Two companies, similar sectors — but very different capital efficiency stories.
|
Financial Data
|
Company A
|
Company B
|
|
EBIT
|
₹5,00,000
|
₹7,00,000
|
|
Total Assets
|
₹30,00,000
|
₹45,00,000
|
|
Current Liabilities
|
₹10,00,000
|
₹12,00,000
|
|
Equity
|
₹15,00,000
|
₹20,00,000
|
|
Debt
|
₹10,00,000
|
₹15,00,000
|
Step 1: Calculate Capital Employed
Company A: ₹30,00,000 − ₹10,00,000 = ₹20,00,000
Company B: ₹45,00,000 − ₹12,00,000 = ₹33,00,000
Step 2: Apply the ROCE Formula
Company A: (₹5,00,000 ÷ ₹20,00,000) × 100 = 25%
Company B: (₹7,00,000 ÷ ₹33,00,000) × 100 = 21.21%
What does this tell us? Company B earns more in absolute terms — ₹7 lakh versus ₹5 lakh. But Company A is the more efficient business. It generates higher returns from a smaller capital base. That's the insight ROCE delivers that raw profit numbers simply cannot.
ROCE vs ROE vs ROA — What's the Difference?
All three are profitability ratios. But they answer different questions.
|
Category
|
ROCE
|
ROE
|
ROA
|
|
Full Form
|
Return on Capital Employed
|
Return on Equity
|
Return on Assets
|
|
Formula
|
EBIT ÷ Capital Employed
|
Net Income ÷ Shareholder Equity
|
Net Income ÷ Total Assets
|
|
Measures
|
Total capital efficiency (debt + equity)
|
Shareholder returns
|
Asset utilisation
|
|
Best Used For
|
Companies with mixed debt-equity funding
|
Evaluating investor returns
|
Asset-heavy businesses
|
|
Key Limitation
|
Affected by large idle cash reserves
|
Can be inflated by high leverage
|
Ignores capital structure
|
ROCE is the broader lens. When a company has significant debt, looking only at ROE can be misleading — leverage artificially boosts returns on equity. ROCE keeps that honest.
What Is a Good ROCE?
There's no universal answer. But here's how most analysts think about it:
-
15% to 20% or higher is the widely accepted benchmark for a healthy ROCE
-
A consistently rising ROCE over 3–5 years matters more than a single year's number
-
Always compare within the same sector — capital-intensive industries like steel or infrastructure will naturally show lower ROCE than software businesses
-
A higher ROCE relative to the sector average strongly suggests competitive advantage
ROCE Across Economic Cycles
ROCE doesn't exist in a vacuum. The broader economy pulls it up and pushes it down.
Expansion phase — demand rises, revenue grows, ROCE improves.
Peak phase — growth begins to plateau, ROCE stabilises.
Contraction phase — demand falls, margins compress, ROCE declines.
Recovery phase — ROCE gradually picks up as conditions ease.
Early growth phase — companies investing heavily in expansion may temporarily show a dip in ROCE, even when the business is fundamentally healthy. That's worth watching, not panicking over.
Why ROCE to Investors
It's one of the most telling metrics for comparing how well different companies use their available capital. Two businesses in the same sector with similar revenues can have wildly different ROCE figures — and that gap usually tells you something important about management quality, pricing power, or operational efficiency.
Most serious investors don't look at ROCE in isolation. They stack it alongside ROE and ROA to build a more complete picture. A company scoring well on all three is usually worth a deeper look.
Limitations of ROCE — What It Doesn't Tell You
ROCE is useful, but it has real blind spots.
Cross-industry comparisons fall apart. A 12% ROCE in manufacturing and a 12% ROCE in software don't mean the same thing. Different sectors have fundamentally different capital requirements.
Large cash reserves distort the number. If a company is sitting on significant idle cash, its capital employed is inflated — and ROCE looks worse than it actually is operationally.
Book value isn't market value. ROCE is calculated from balance sheet figures, which are historical. Asset values change. Companies that haven't revalued their assets recently may show ROCE numbers that are difficult to interpret accurately.
Single-year analysis is risky. One good year — or one bad one — can skew ROCE significantly. The ratio is far more meaningful when tracked across multiple years.
FAQs
Q: What does a high ROCE actually indicate?
A: A high ROCE means the company is generating strong operating profits relative to the capital it has deployed — both equity and debt. It's generally a signal of efficient management and sound capital allocation. A ROCE consistently above 20% is something most fundamental investors look for.
Q: Can ROCE be negative — and what does that mean?
A: Yes, it can. A negative ROCE means the company's EBIT is negative — it's generating operating losses. This isn't just a red flag; it means the business is consuming capital rather than producing returns from it. It warrants a very close look at why before any investment decision.
Q: What is considered a good ROCE percentage in India?
A: Most analysts use 15%–20% as the baseline for a healthy ROCE in the Indian context. For capital-light sectors like FMCG or IT, top companies often show 30%–50%+. For heavy industries like steel, cement, or power, single-digit or low-teen ROCE may be sector-normal. Always benchmark within the sector.
Q: How is ROCE different from ROE when a company has a lot of debt?
A: This is where the difference really matters. High debt artificially boosts ROE because it reduces the equity base against which profits are measured. ROCE uses total capital employed — debt plus equity — so it doesn't flatter leveraged companies the same way. In heavily borrowed businesses, ROCE is often the more honest profitability measure.
Q: Should I look at ROCE alone when analysing a stock?
A: No. ROCE works best alongside ROE, ROA, debt-to-equity ratio, and free cash flow analysis. A company with great ROCE but deteriorating cash flows, for instance, deserves a second look. Ratios tell stories in context — not in isolation.
Q: Does a rising ROCE always mean the company is improving?
A: Usually, yes — but not always. A rising ROCE can sometimes result from ageing assets that are fully depreciated (reducing the asset base) rather than genuine improvement in profitability. It's worth checking whether the underlying EBIT is also growing, not just the ratio.
Q: How does ROCE relate to EBIT margin?
A: They're connected but distinct. EBIT margin tells you how much operating profit the company makes per rupee of revenue. ROCE tells you how much it makes per rupee of capital employed. A company can have a healthy EBIT margin but poor ROCE if it needs enormous capital to generate that revenue — common in asset-heavy sectors.
Q: Why do some analysts prefer ROCE over other profitability ratios?
A: Because it accounts for both debt and equity, ROCE gives a fuller picture of how efficiently the entire capital structure is working. It's particularly useful when comparing companies in the same industry with different funding approaches — some equity-heavy, some debt-heavy.
Q: How does capital employed change if a company has excess cash?
A: Cash sitting on the balance sheet increases total assets without contributing to revenue generation, which inflates capital employed and drags ROCE down. Some analysts adjust for this by subtracting excess cash from capital employed to get a cleaner picture of operational efficiency.
Q: Can two companies with the same ROCE have very different business quality?
A: Absolutely — and this is one of the subtler points about ROCE. A company with 20% ROCE achieved through a lean, asset-light model is very different from one reaching 20% ROCE by taking on significant financial leverage. The ratio looks the same. The underlying risk profile does not.